CYBER THREATS RANKING – A NEW CHALLENGE FOR THE TRUSTED LONG MATRIX
In this post I’ll show you how to produce an actionable Strategic Threat Assessment (STA) using the Sleipnir matrix.
Moreover, I’ll show you how to do it using both the trusted Long Matrix 1.0 and the newer Long Matrix 2.0.
And last of all, I’ll reveal how a simple tweak can add extra depth to an STA.
Our topic is the ranking of cyber threats.
Cyber threats are a murky business. Its actors use through-the-looking-glass technology. Their operational modalities are otherworldly. Their organization is wraithlike.
All in all, it’s a fairly new territory for conducting a STA using the Long Matrix.
STA IS A PRODUCT OF STRUCTURED ANALYSIS. HERE ARE THE STEPS INVOLVED.
- Step 1. Use divergent thinking (brainstorming) to identify as many targets for analysis as possible within an agreed time span (as a rule of thumb, 30 minutes).
- Step 2. Switch to convergent thinking to generate a shortlist of seven targets.
- Step 3. Conduct intuitive ranking.
- Step 4. Conduct pair ranking.
- Step 5. Fill out a simple T4 matrix.
- Step 6. Fill out an extended T4 matrix combined with Long Matrix 1.0.
- Step 7. Fill out a LM 12 matrix as transition from Long Matrix 1.0 to Long Matrix 2.0.
- Step 8. Fill out a LM 2.0 matrix.
- Step 9. Add calculation of actor-specific risk at attribute level and of compound risk index.
CYBERATTACKS MOs ARE RICHER THAN YOUR PEACOCK’S TAIL.
Cyberattacks – real, alleged or dreamed up – against elements of political and state organizations have become the talk of the town.
Some of those are credited with aiming to rig election outcomes by hijacking social media to manipulate public opinion.
Others focus on unauthorized disclosure of classified information.
Yet others center on covert and unlawful acquisition of strategic state secrets.
The subject of cyberattacks is a sizzling one. That’s reason enough for a group of my students to choose cyber threats ranking as subject of a team project on the use of selected STA techniques.
In my view, they did a smashing job. But I’ll let you form your own opinion a bit later on in this post when I walk you through their work.
At the start, though, I had my doubts that the STA techniques I am teaching are suited for the analysis of this threat.
Let me explain why.
STRIPPED DOWN TO THE ESSENTIALS, STA IS A TOOL USED TO SET PRIORITIES FOR ALLOCATION OF SCARCE RESOURCES ASSIGNED TO MITIGATION OF STRATEGIC THREATS.
Since these resources are typically grossly insufficient to address all identified threats, some threat prioritization is due.
An STA would thus aim to produce actionable knowledge.
- Of threat posed by a malicious agent being a possibility of damaging action as an outcome of deliberate planning.
- Of harm being the damage occurring should a threat be realized.
- Of risk being the probability of materialization of harm.
- Of vulnerability being aspects of the environment offering to the threat opportunities to cause harm.
MY ISSUE WITH STA’S IS THAT THEY ARE OFTEN MADE UP OF VAGUE DISCOURSE. WHAT’S THE REMEDY?
Somehow the notion of “strategic” had become firmly paired with vague clichés. And particularly in connection with foreign policy analysis.
As a remedy, I am teaching the use of the expanded T4 matrix used in combination with the Sleipnir (also known as Long Matrix) technique.
This synthetic tool permits rank-ordering malicious agents by a compound threat index made up by the two subcategories of Intent (Desire+Expectation) and Capability (Resources+Knowledge).
A GREAT ADVANTAGE OF THE T4 TECHNIQUE IS THAT IT DEALS WITH THREAT AS THE OUTCOME OF A DELIBERATE ACT.
This makes it highly useful in the protective security, law enforcement and national security environments.
A downside of the T4 technique is that it is a bit lopsided. While its treatment of threat is very robust, the treatment of harm remains rather basic.
Here is a simple rendering.
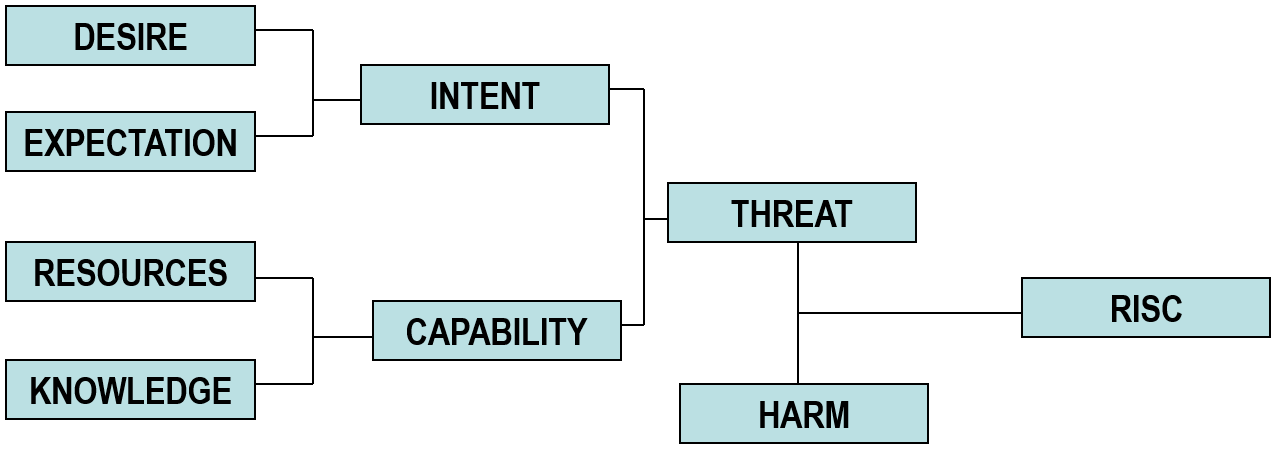
Reading it backwards, what ultimately bothers policy planners most is the harm that can be caused by the realization of a threat.
Harm, however, is relativized by risk that involves an estimation of the probability of threat realization.
A net threat before becoming compounded with harm and risk assessment is the product of intent and capability of a malicious agent. Intent is made up of desire end expectation (of a benefit accruing to the agent by the realization of a threat). Capability is made up of resources and knowledge.
USING A STRUCTURED APPROACH WOULD BE THE FIRST STEP TOWARDS FREEING ANALYTIC PRODUCTION FROM ADDICTION TO PURE DISCOURSE.
The turning point, however, comes with deciding how we assess Intent and Capability.
Or, taking another step away from discourse, how do we derive them from Desire+Expectation and Resources+Knowledge, respectively.
Enter the Sleipnir model.
It represents an “analytical technique developed to rank order organized groups of criminals in terms of their relative capabilities, limitations and vulnerabilities. The rank ordered lists of groups are components of strategic intelligence assessments used to recommend intelligence and enforcement priorities for the Royal Canadian Mounted Police…This technique uses rank ordered sets of attributes for comprehensive, structured and reliable measurement and comparison of qualitative information about organized criminal groups… Each attribute is defined, weighted, and has a set of defined values. The definitions minimize the degree of subjectivity in interpreting and assessing information for these assessments…”
from “Project SLEIPNIR: An Analytical Technique for Operational Priority Setting”, Steven J. Strang, 2005
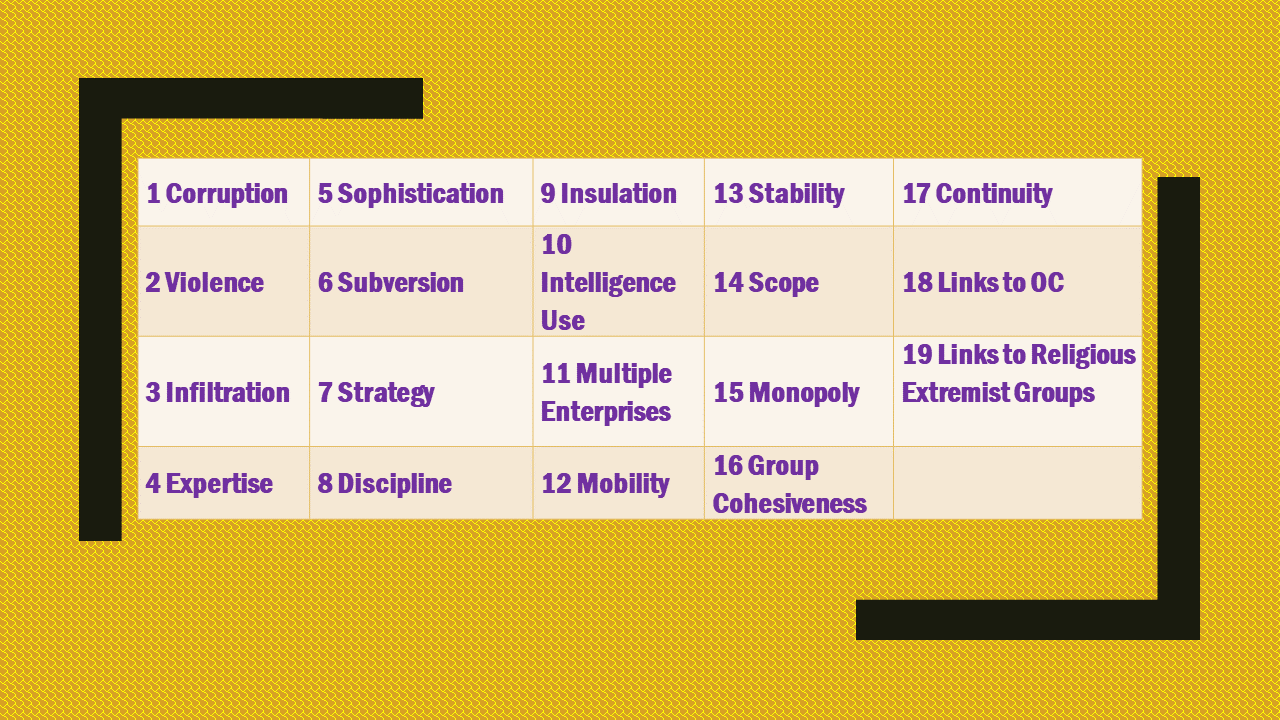
Putting it in a nutshell, Sleipnir model is a ranked listing of 19 attributes. That’s why it is also called the Long Matrix:
THE LONG MATRIX ALLOWS ANALYSTS TO RANK-ORDER GROUPS OF MALICIOUS AGENTS IN AN OBJECTIVE, COMPREHENSIVE AND SYSTEMATIC WAY.
AN OUTCOME IS A RANK-ORDERING OF SPECIFIC GROUPS OF MALICIOUS AGENTS BY THE LEVEL OF THREAT THEY POSE TO PEOPLE, INSTITUTIONS AND THE SOCIETY AS SUCH.
- IT AIMS TO PRODUCE ACTIONABLE INTELLIGENCE. Authorities at different governance levels can use it while choosing threat response strategies and setting priorities.
- IT CAN ASSIST IN MEASURING THE EFFECTIVENESS OF DISRUPTIVE ACTIONS. Success or failure of proactive or reactive strategies can be ascertained by monitoring changes in the rankings of threat agents over several years.
- IT CAN SHOW THE LEVEL OF SUCCESS OF DISRUPTIVE MEASURES AIMED TO DEGRADE SPECIFIC CAPABILITIES OF GROUPS OF MALICIOUS AGENTS. This represents a more tactical objective of deflecting or neutralizing specific threats.
- IT CAN SHOW THE RESILIENCE OF GROUPS OF MALICIOUS AGENTS TO DISRUPTIVE ACTIONS and their ability to recover and restructure their operations.
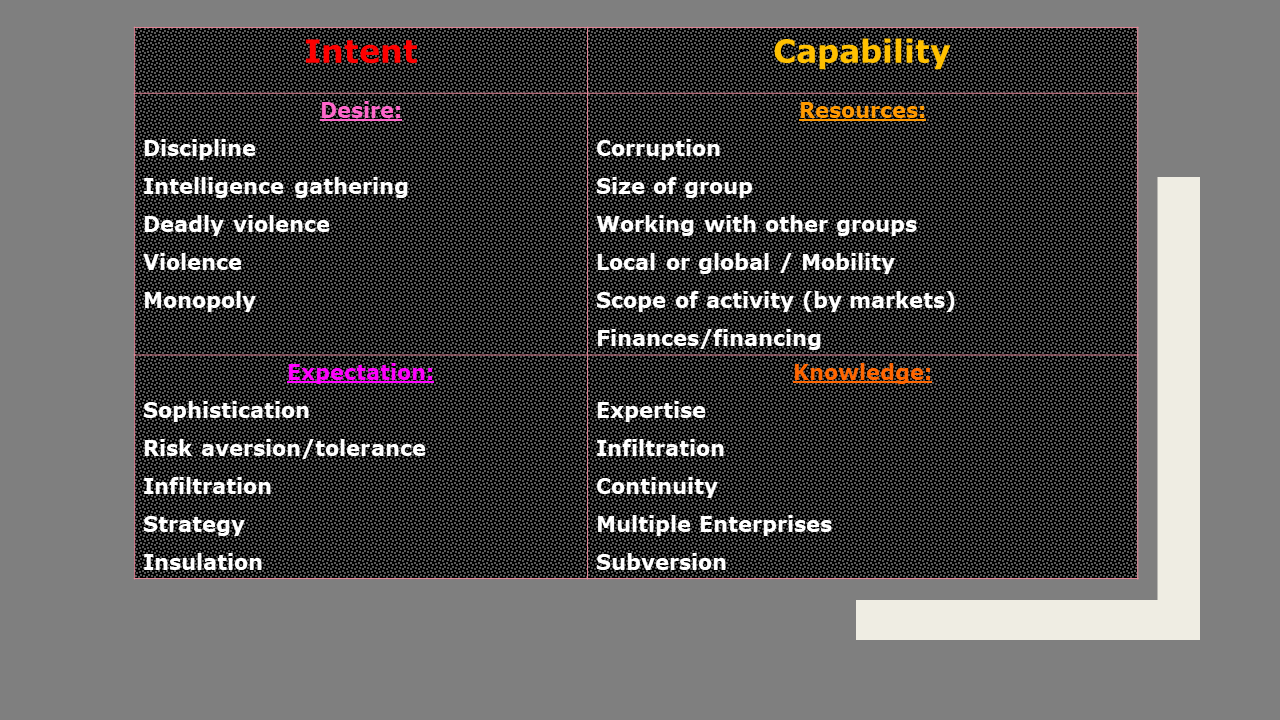
THE EXPANDED T4 MATRIX AIMS TO ESTABLISH A STRUCTURED AND REPEATABLE PROCEDURE FOR THE DERIVATION OF THE THREAT INDEX COMPONENTS.
The method is to assign elements of the T4 matrix Long Matrix attributes. Here is an example.
The Long Matrix was originally developed back in the 1990s by the Royal Canadian Mounted Police. The immediate objective was to make strategic criminal intelligence analysis products more actionable. When used for that purpose, it has achieved a remarkable degree of acceptance and success.
But its list of attributes seems to have but only limited application to strategic threat assessment in the context of national security or foreign affairs.
One, it is best suited for the analysis of CLEARLY IDENTIFIED GROUPS of malicious agents.
Two, it applies particularly well to the analysis of groups engaging IN CRIMINAL, ILLEGAL or UNLAWFUL ACTIVITIES.
The Long Matrix is thus not suited at all for analysis of military threats. Its treatment of threats posed by legitimate operators – political parties, foreign governments, or businesses – also involves stretching it a tad . At least, for as long as they stay legit.
Besides that, Sleipnir was based on assumptions that determine the greatest perceived threats to Canadian society. The rank ordering of attributes may thus not necessarily reflect those relevant to other societies or jurisdictions.
As one example, placing the attribute “Links to religious extremist groups” at the very bottom of the list does not look convincing, anymore. The weight of this attribute in the context of analysis of terrorist threats or threats caused by self-declared rogue territorial administrators has of late experienced a dramatic growth.
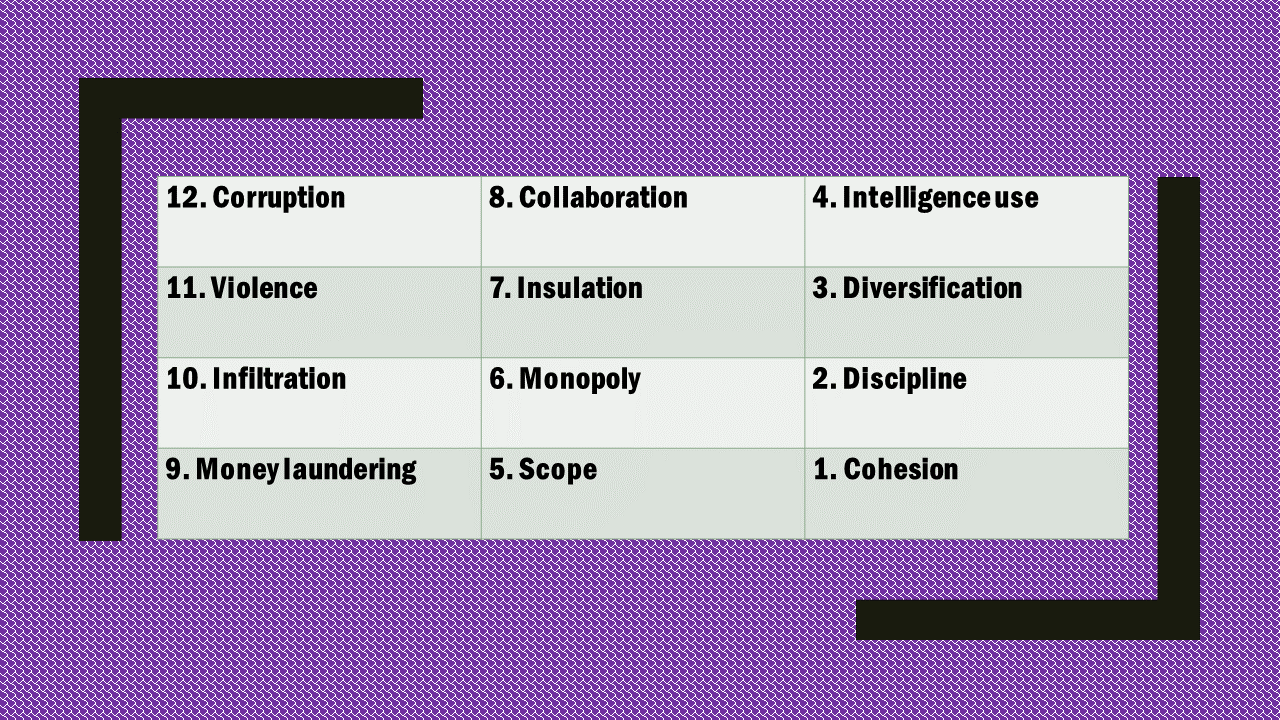
As I have mentioned, the first version of the Long Matrix was launched in the mid-1990s. Sometime around 2010, Royal Canadian Mounted Police conducted a revision that became known as Long Matrix 2.0.
The number of attributes was reduced to 12. And they were weighted much more heavily. The topmost attribute of Corruption has acquired 12 times the weight of the Cohesion attribute at the list’s very bottom. The attribute of “Links to religious extremist groups” migrated to a separate set of attributes to be specifically used for counter-terrorism assessments.
Now, let me introduce my students.
Ms. Camille-Ann Laplante is enrolled in the Master’s degree programme of the Institute of Political Studies (Sciences Po) in Paris (France).
Ms. Salome Wittwer is a student in the Master’s degree programme in International Affairs and Governance at the University of St. Gallen (Switzerland).
Ms. Jutta Ritter is enrolled in the Master of Science programme in Business Administration with a focus on the competency fields of Marketing and Strategy as well as Technology and Innovation at Ludwig-Maximilians-University in Munich (Germany)
Ms. Armony Laurent is a student in the Master’s degree programme of the Institute of Political Studies (Sciences Po) in Strasbourg (France).
Ms. Anna Friedemann studies in the Master’s degree programme “World politics” of the Institute of Political Studies (Sciences Po) (France)
THEIR PROJECT FOCUSED ON THE ANALYSIS OF CYBERSECURITY THREATS FACING THE US GOVERNMENT.
Every analytic project should start with determining from what/whose perspective the analysis will be conducted. This group chose to assume the perspective of the US Government.
In the real world, adopting alien perspectives including those of one’s adversaries is very likely to render analysis useless.
It is mostly an illusion to feel like one is capable of imitating the thinking and reasoning processes of other people. At best, one achieves mirror imaging, letting oneself be subconsciously led by one’s mindset.
One thinks to be reasoning like their opponent is likely to be reasoning.
But in reality, one thinks to be reasoning like one thinks their opponent is likely to be reasoning.
Got the subtle difference?
The latter is a far cry from the real thing. And basing own strategic choices on illusions is absolutely fatal.
A big obstacle here is posed by individual biases that often operate at the subconscious level and hijack analytic mind-sets. You can’t just shed those like old snake skin when trying to switch personas. Biases will inevitably contaminate attempts at making inferences from an alien perspective.
But I find such stretching (and twisting) of reasoning to be quite all right in the context of a student project.
NOW, LET’S START THE WALK-THROUGH OF MY STUDENTS’ FINDINGS.
STEP 1. Use divergent thinking (brainstorming) to identify as many targets for analysis as possible within 30 minutes.
The result was a longlist of groups known/suspected of engaging in cyberattacks of the most different kind.
STEP 2. Switch to convergent thinking to cluster/reduce the number of targets to seven.
This step produced the following unranked shortlist (attribution of origin is students’ opinion):
-
- Anonymous movement (well, anonymous…).
- Fancy Bear (Russia).
- Dragonfly (Eastern Europe).
- Syrian Electronic Army (Middle East).
- Comment Crew (China).
- Lazarus Group (North Korea).
- WikiLeaks (not defined).
STEP 3. Conduct intuitive ranking.
The resultant ranking order came out as follows:
1. Fancy Bear.
2. Comment Crew.
3. WikiLeaks.
4. Dragonfly.
5. Syrian Electronic Army.
6. Lazarus Group.
7. Anonymous movement.
No surprises for me so far. While the intuitively top-ranked actors have received extensive media coverage those at the bottom of the list have not. I see little coincidence in that circumstance.
Exposure to media sources can be toxic for analysts. Their signal-to-noise ratio is in many cases abysmally low. But they can still hijack analyst’s reasoning. Mind-sets are quick to form but resistant to change. Particularly when starting research on a previously unfamiliar topic, it is best to delay exposure to the media until after forming an initial impression by tapping into less speculative sources.
STEP 4. Conduct pair ranking.
This is the first attempt at structuring one’s perceptions.
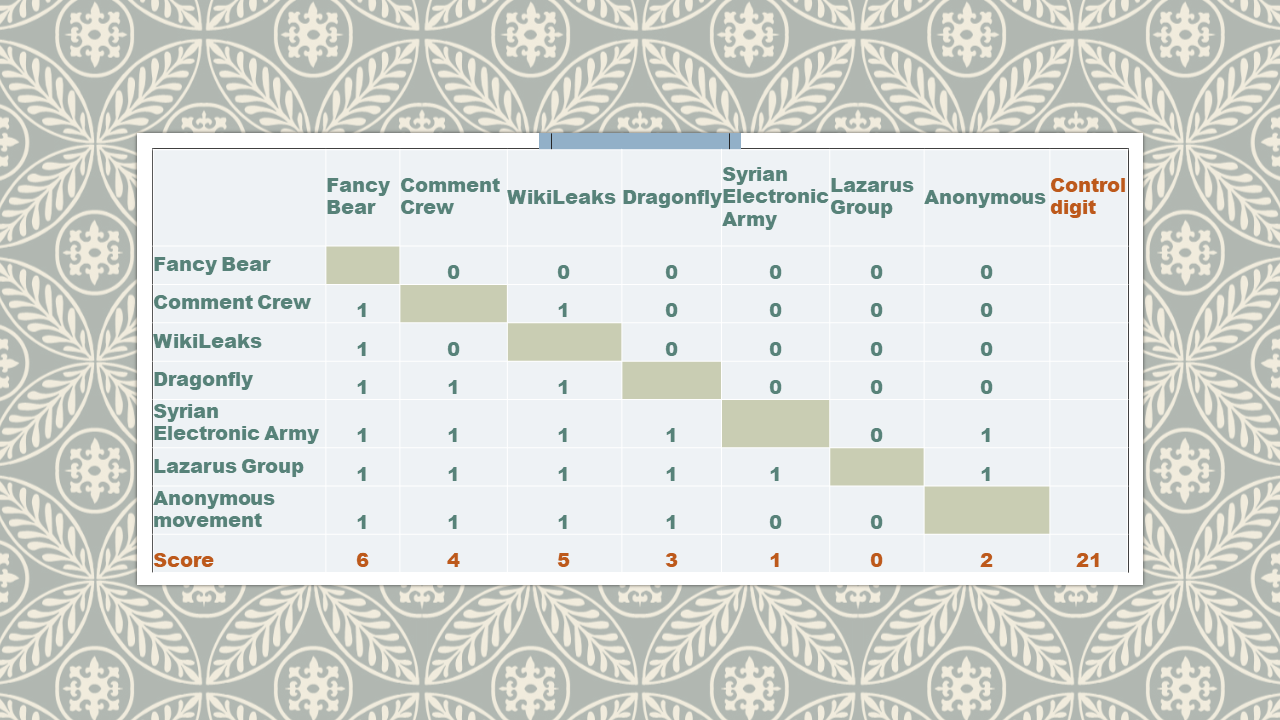
The resultant ranking has mostly reshuffled the lower part of the list.
1. Fancy Bear (FB).
2. WikiLeaks (WL).
3. Comment Crew (CC).
4. Dragonfly.
5. Anonymous movement.
6. Syrian Electronic Army.
7. Lazarus Group.
The rise of WikiLeaks, in my view, could well reflect students’ hindsight bias.
An outside observer could be tempted to think that most of WikiLeaks revelations involved information sensitive for the USG. That assumption would be further corroborated by November 2018 reports to the effect that the USG had at some time filed sealed charges against Julian Assange. Those and abundant other similar stories could rationalize a consequent inference that the USG ranked WikiLeaks as a major security threat.
In the subsequent steps involving use of the T4 matrix and the Long Matrix, my students have chosen to compare only three top-ranked threat agents. This is a convention, of course. With a comparable outlay of effort one could deal with all seven contenders.
Choosing between the two approaches will essentially depend on the tasking the analysts will have received.
In our case, the assignment was to identify the single most important threat. That justifies the focus on the three winners of the pair ranking contest. Despite its apparent simplicity, this technique can be trusted to reflect true perceptions with a high degree of accuracy.
STEP 5. Fill out the T4 matrix.
Each attribute can have the following values – High (4), Medium (3), Low (2), Nil (1), Unknown (0).
Harm can have the following values – Catastrophic (5), Major (4), Moderate (3), Minor (2), Insignificant (1).
Probability can have the following values – Almost certain (5), Probable (4), Possible (3), Unlikely (2), Rare (1).
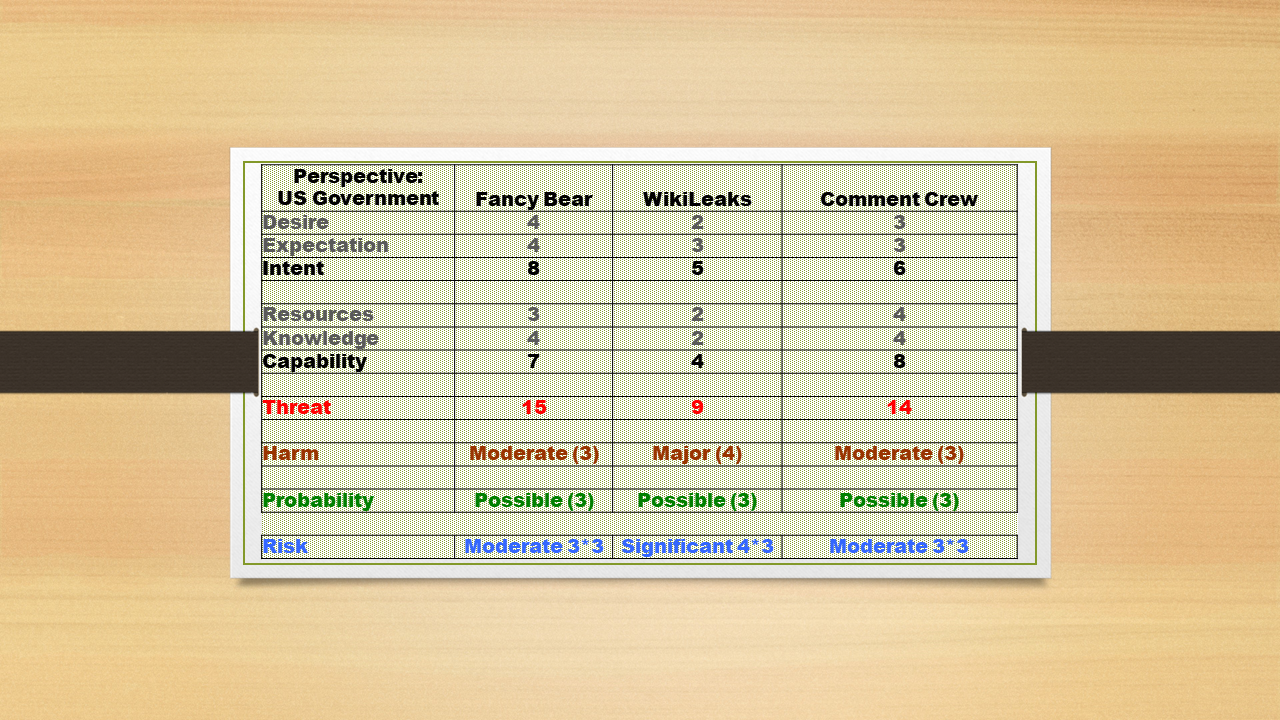
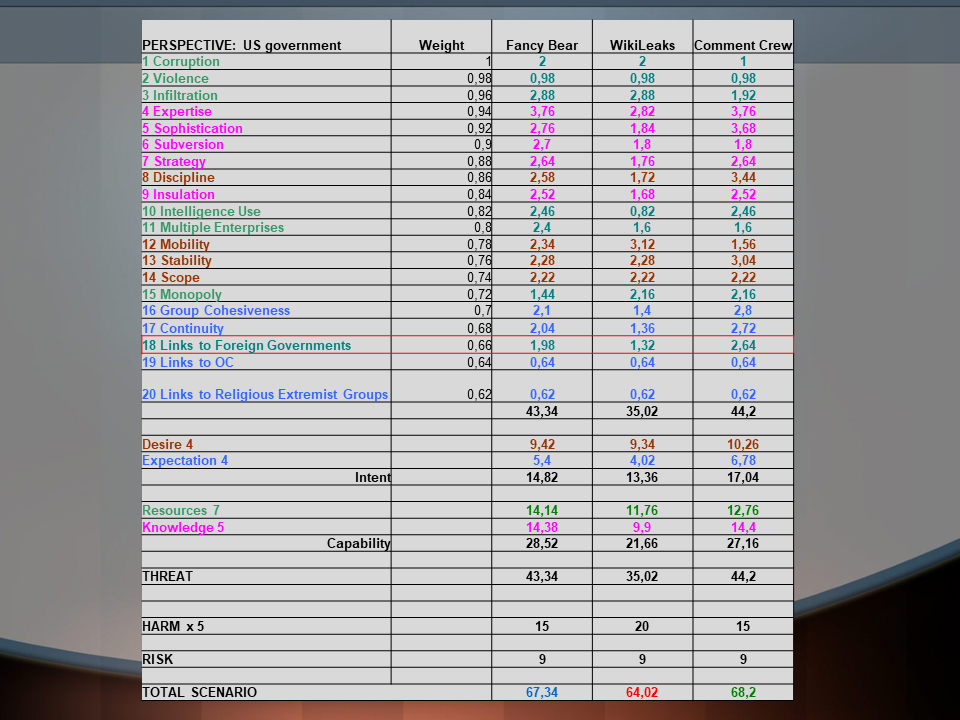
So, in my students’ opinion, WikiLeaks appears to be not quite keen on carrying out its threat. Nor is it assessed to have the capability required for it. As a result, WL lags far behind the other two contestants.
STEP 6. Combine T4 matrix with Long Matrix 1.0
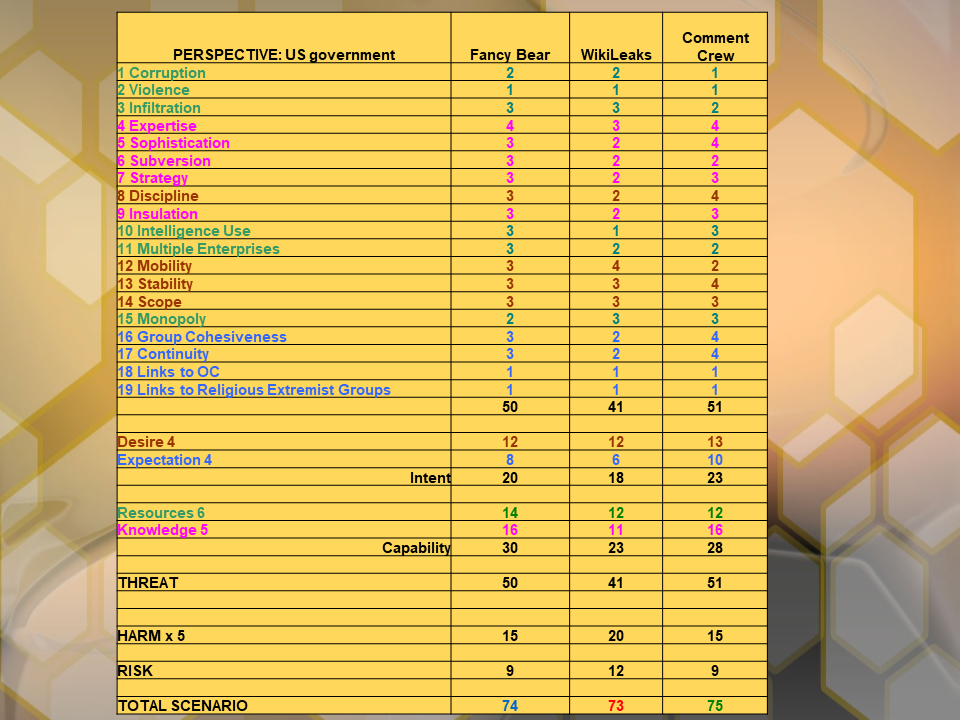
One can clearly observe the impact of harm and risk assessment on the comparative ranking of threats.
Now, it is useful to keep in mind that the 19 attributes in the Long Matrix 1.0 are rank-ordered.
It means that in order to fine-tune the threat index net of harm and risk coefficients, we could (and even should) weight the values assigned to each attribute.
A logical weighting step could be 0,01. Attribute 19 would then have 0,82 weight of Attribute 1. Applying this weighting step yields the following result.
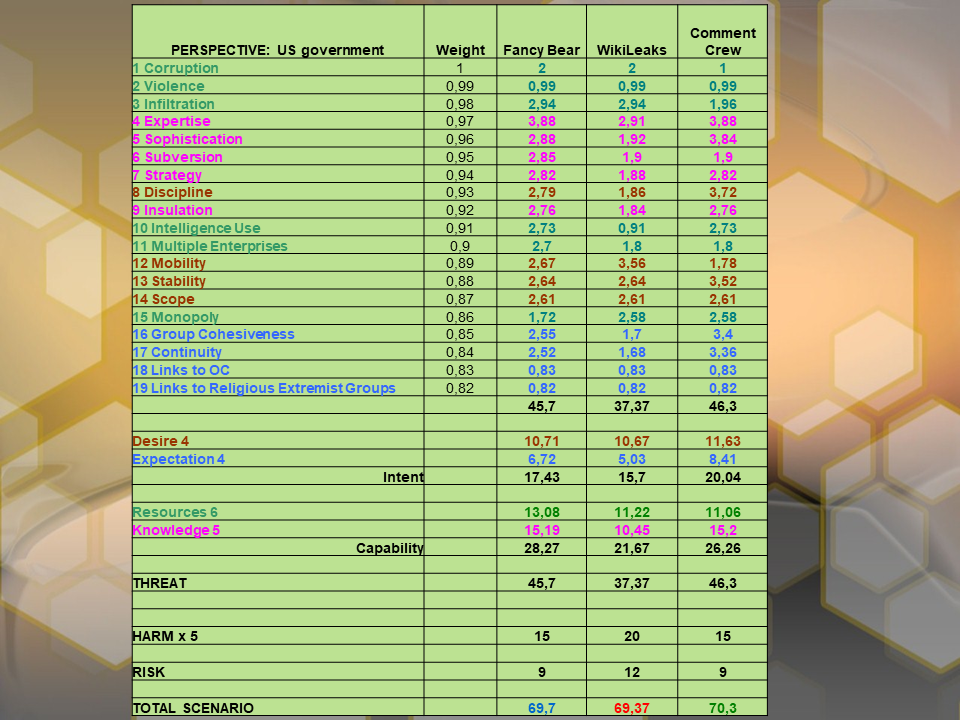
The granularity of threat indices increases but it does not lead to changes in the ranking order.
Next, I’ll raise the weighting step to 0,02. In my view, this is about the limit dictated by common sense. Attribute 16 will have now only 0,64 of the weight of Attribute 1.
The application of this rather extreme weighting did result in some shifts in the ranking order of threats.
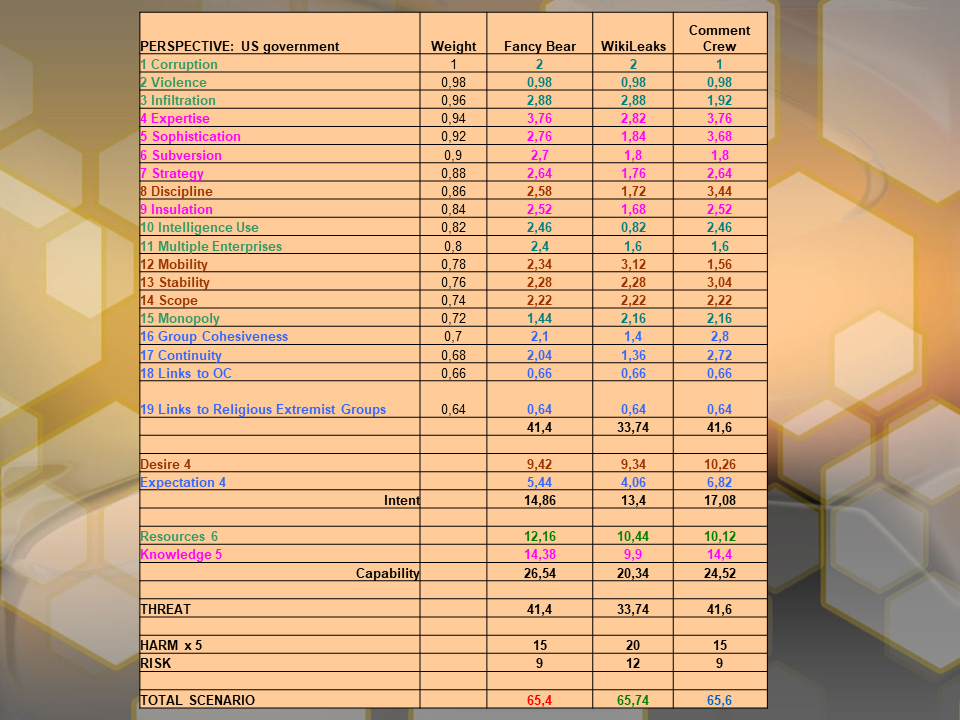
First of all, the three contenders are now jammed within a spread of only 0,34. Remember, it was two whole points in the non-weighted matrix.
And WL, after trailing third in both previous calculations, suddenly ends up in the lead.
NEXT THING MY STUDENTS DID, WAS ADD ANOTHER ATTRIBUTE TO THE 19 – “LINKS TO FOREIGN GOVERNMENTS”.
Their rationale was that foreign government sponsorship of a cyber antagonist would likely indicate that the focus of its activities pushed over into the political dimension.
The possibility of such refocusing is equally likely to influence our chosen perspective’s threat perception.
For this new attribute students assigned the values of three (FB), two (WL) and four (CC).
The result of this fairly simple adjustment was to completely upset the previous outcome.
CC got the top-threat rank with FB as the runner-up and WL taking up the distant rear. And the CC margin proved to be sufficient for standing both weighting tests.
STEP 7. THE DIFFERENCE BETWEEN LONG MATRIX 1.0 AND LONG MATRIX 2.0. IS TWO-FOLD.
On the one hand, the number of attributes has been reduced by a third, to only 12.
On the other, a draconian weighting schedule has been introduced.
In LM 2.0 the top-ranking attribute has 12 times the weight of one at the bottom of the list. As a result, one can expect severe shifts in the ranking order of threats as compared to the outcome of LM 1.0.
One objective of the assignment was to test how use of different matrices affects ranking outcomes. With that in mind, students were requested to establish a kind of a half-way index. A bit later on, it could help reconcile the outcome of an unbuffered application of Long Matrix 2.0 with their earlier findings.
This intermediate matrix is limited to the 12 attributes of LM 2.0 but applies the same method of weighting used in LM 1.0.
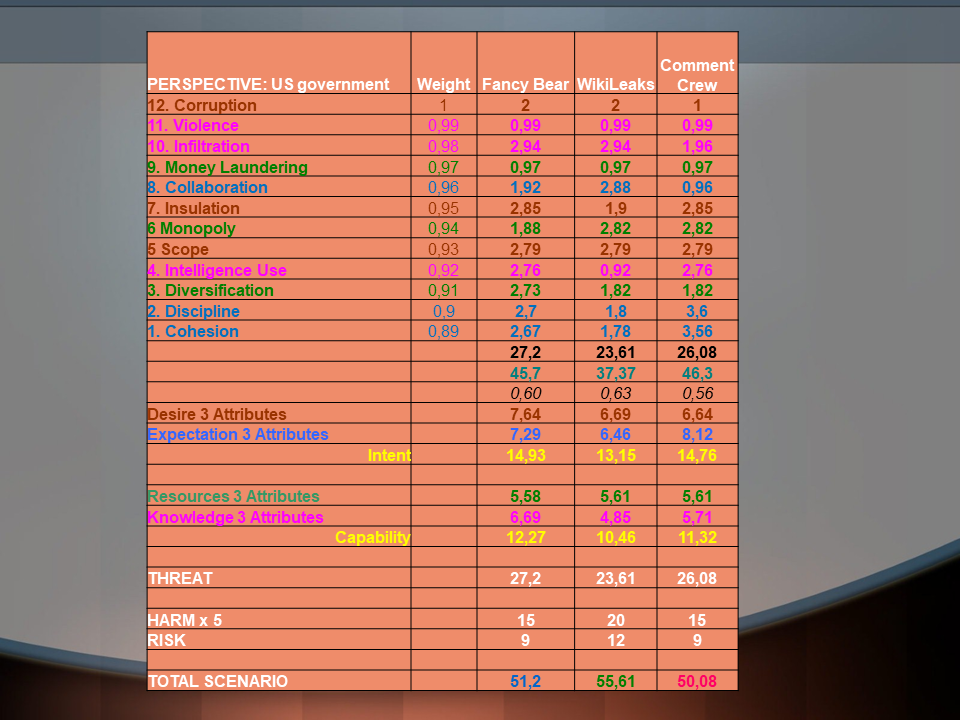
WL TOOK THE TOP SPOT RIGHT AWAY AND WITH AN UNASSAILABLE MARGIN. AND IT CAN BE EASILY EXPLAINED.
The sum of attribute values (net threat) went down by close to a half due to the reduction in the number of attributes from 19 to 12.
As a result, the factual weight of harm assessment showed a matching increase as its net values remained unchanged.
In other words, harm and risk valuations imported from LM 1.0 acquire a particularly high level of impact on the total threat index.
This outcome is not necessarily an undesirable one.
Clients that for some reason are particularly vulnerable and as a consequence risk- and harm-averse may actually appreciate it. For all those others, the multiplier of harm will need to be adjusted.
HERE IS THE UNEDITED PROJECT REPORT WHERE MY STUDENTS OFFER A SUMMARY OF THEIR FINDINGS AND CONCLUSIONS.
Project title: Cybersecurity Threats Facing the U.S. Government
START OF QUOTE.
The alleged meddling of Russian hackers in the U.S. presidential elections of 2016 put the topic of cybersecurity in the limelight. In this threat analysis, we look at this issue from the perspective of the U.S. Government. We define the threats in terms of the objective of harming the U.S. Government.
Cybersecurity is a complex issue even for professionals. There is little transparency regarding the composition, methods and goals of some of the actors. We do not have the benefit of personal insight. Nevertheless, in our view the relevance and topicality of the issue qualify it for the additional research.
Due to the limited amount of prior knowledge of the topic, our group had few strong preconceived opinions about the actors. At the same time, our exposure to the image of Russian hackers created by the media represented a potential source of bias. To avoid bias contamination, we conducted the initial research separately.
A listing of actors compiled by cybersecurity experts of Nextron Systems, a leading provider of compromise assessment software, served as the starting point of our assessments.
We used it to compile our own list of groups posing a strategic threat to U.S. Government cybersecurity.
It represented actors from across the issue, including cyber warfare, political interference through social media, and unauthorized possession and disclosure of classified information. We also made sure it included groups of different geographical origin.
Following this approach we then chose the most effectual groups in each of the categories.
Among them, WL looked like the odd one out.
It is true that WL does not actually perform cyberattacks. Nonetheless, we consider the group an actor in the area of cybersecurity while it discloses online confidential and classified information provided by hackers and individual whistle-blowers. Such disclosure presents a security threat as it compromises covert sources and protected communication channels.
Our pair ranking identified Fancy Bear (FB), WikiLeaks (WL) and Comment Crew (CC) as the most important threats.
The differences between intuitive and pair ranking were minor.
Apart from a switch of ranks in the top three, which we considered to be ranked very close from the beginning, it is mainly the assessment of the Anonymous group that has changed. It is difficult to estimate the threat posed by a dispersed group without a clear goal or leader.
Our intuitive ranking put FB and CC as a significantly bigger threat than WL. However, we gave only WL a harm score of “major”. Information previously published by WL included military secrets and surveillance intelligence. Making it available to an unlimited audience was a clear and present threat to the U.S. security.
As far as FB is concerned, its activities appear to be mainly cyberattacks against a wide range of targets including private citizens, governments as well as military and political organizations. Their core goal is disruption.
Finally, CC is assessed to be closely related to the Chinese Army. It mainly seeks to extract sensitive data from U.S. companies and government agencies.
Analysis using LM 1.0 produced the following ranking: CC (75 points), FB (74), WL (73).
The scores of the three groups become even closer when applying the weights. The ranking changes with the second application of weights, making WL the most significant threat.
On the one hand, this implies that WL scores higher in the more dangerous attributes. On the other, the weights applied in this analysis are very strong and the margins of 0.14 and 0.34 points are comparatively small.
Reducing the number of attributes to 12 (LM12) results in the following ranking: WL (57), FB (53), CC (52).
The ranking order of threat actors and clear margins in points remain unchanged in the two applications of weights.
Looking more closely at the composition of these results, it becomes evident that the two hacker groups score significantly higher in the threat section of the analysis (using either 19 or 12 attributes).
WL scores higher with its harm and risk indices that reflect our assessment of the larger harm to US security its activities are causing.
Since this section makes up a larger share of the total score in LM12, WL now not only comes even with the scores of the other two, but actually trumps them by a clear margin.
However, our harm assessment hinges on our prediction of what information will be made available to the WL. If its harm level is reduced to “moderate”, WL total threat indices fall far behind the other two groups in all scenarios.
Which analytic technique produces a better reflection of our threat perception?
On the one hand, LM 1.0 includes some attributes that are not relevant to the issue of cyberspace (for example, a link to OC).
On the other, some of the attributes omitted from LM12, like expertise and sophistication, are in our view highly relevant to the threat posed by a group in cyberspace. The difference in scores between our groups in these attributes is no longer reflected in the shortened analysis.
We consider the share of harm and risk indices in the total scenario to be a matter of opinion. However, since the harm estimate of WL was a subject of debate, we consider LM 1.0 to be on the whole more suitable for our analysis.
We decided against including LM 2.0. in our project. Its weighting model is very far from our threat perception.
Instead, we tested the consequence of including an additional threat attribute in LM 1.0.
“Links to Foreign Governments” is particularly relevant to the subject of our analysis.
Adding this attribute consistently results in the following ranking: CC, FB, WL. The margins remain significant even after adding weights.
In this adjusted analysis, the weight of the net threat section vis-à-vis the harm and risk section has further increased, which explains WL’s lower score.
Furthermore, the margin between CC and FB has increased, making for a clearer case between the two hacker groups.
CONCLUSION: AFTER WE MADE ISSUE-RELEVANT ADJUSTMENTS TO ANALYTIC TECHNIQUES, CC IS IDENTIFIED AS THE MOST SIGNIFICANT CYBERSECURITY THREAT TO THE U.S. GOVERNMENT.
However, our results may be distorted by a bias caused by our lack of specific knowledge about actors, their activities, and broader groups’ strategies.
Our suggested ranking represents our best assessment. But its accuracy in identifying the most significant threat to U.S. cybersecurity should nevertheless be viewed critically.
END OF QUOTE.
Right, so my students have found what seemed to them a valid reason to nicely skirt the application of LM 2.0.
However, comparison of results obtained through the use of LM 1.0 and LM 2.0 is of a long-term interest to me. So, I completed the last matrix myself using my students’ data.
STEP 8. THE “WOW” EFFECT OF COMPLETING A LM 2.0 MATRIX.
For the sake of maintaining consistency, I made sure to export attribute values from the students’ LM 12 matrix that they had also used in the first LM19 matrix.
I got the net (unweighted) threat rankings of FB 29, CC 28, WL 25.
As a next step, I factored in attribute weight. The resultant adjusted threat ranking was FB 168, WL 161, CC 144. Wow…
FB KEPT THE LEAD, BUT THE RUNNERS-UP TRADED RANKING SLOTS IN A SPECTACULAR WAY.
WL shot up like a rocket, and CC went down like a brick. That’s a convincing demonstration of the power of LM 2.0 approach to weighting.
Then came the turn of Harm and Risk. I applied initial students’ assessment that had hijacked total scenario indices calculated using LM 12.
In a full LM 2.0, however, the impact of harm and risk indices was all but eclipsed by the combined mass of weighted attributes.
The resultant scores were WL 193, FB 192, CC 168.
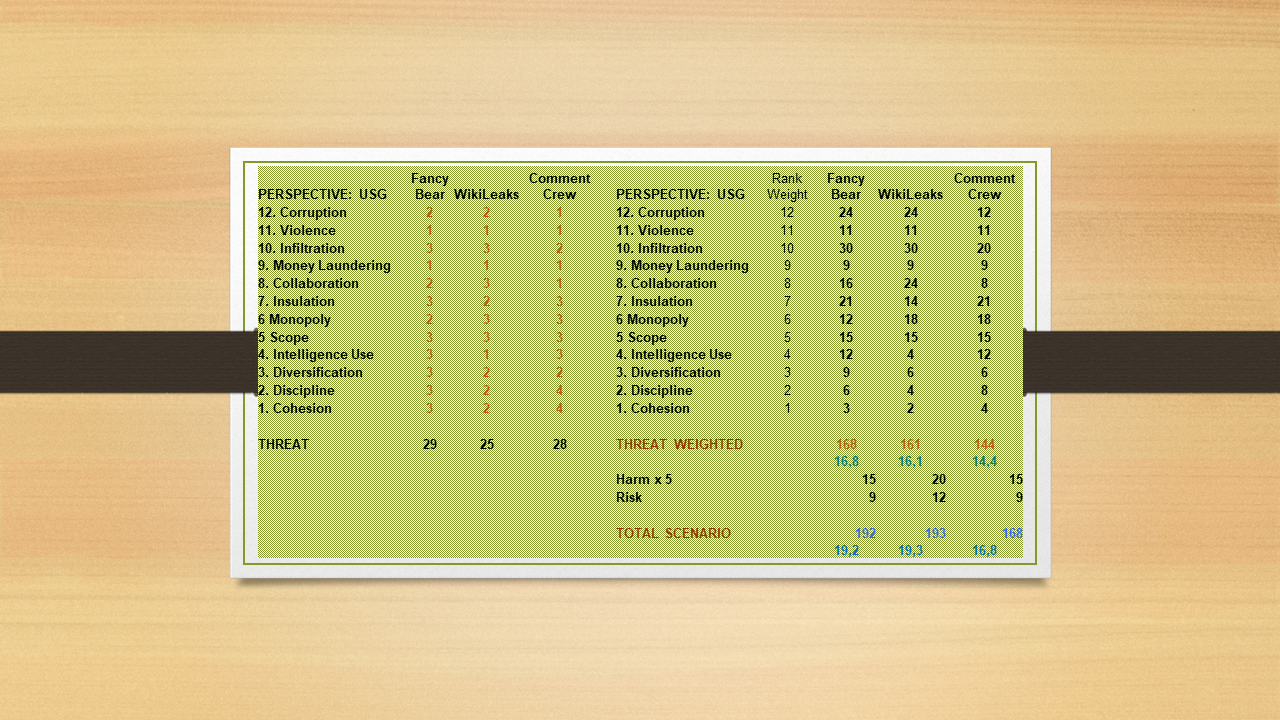
A students’ judgment that involved assigning WL activities MAJOR harm and MAJOR probability of it occurring just BARELY PERMITTED WL to scrape its way past FB to the top of the threat ranking. Interesting…
Come to think of it, use of BOTH Harm and Risk indices results in a bit of a double-dip that skews analysis. After all, the Risk index is calculated as Harm*Probability.
STEP 9. SETTING ANALYSIS STRAIGHT BY CALCULATING ACTOR-SPECIFIC RISK AT ATTRIBUTE LEVEL.
To further test the consistency of LM 2.0 method I decided to try a different tack.
I assigned individual risk values to each attribute for each of the three contestants. Meaning individual harm and individual probability. They turned out to be mostly similar.
But only MOSTLY. Due to the heavily weighted method of LM 2.0, a minor variance in the risk assessment of only one top-ranking attribute caused a huge difference in the end result.
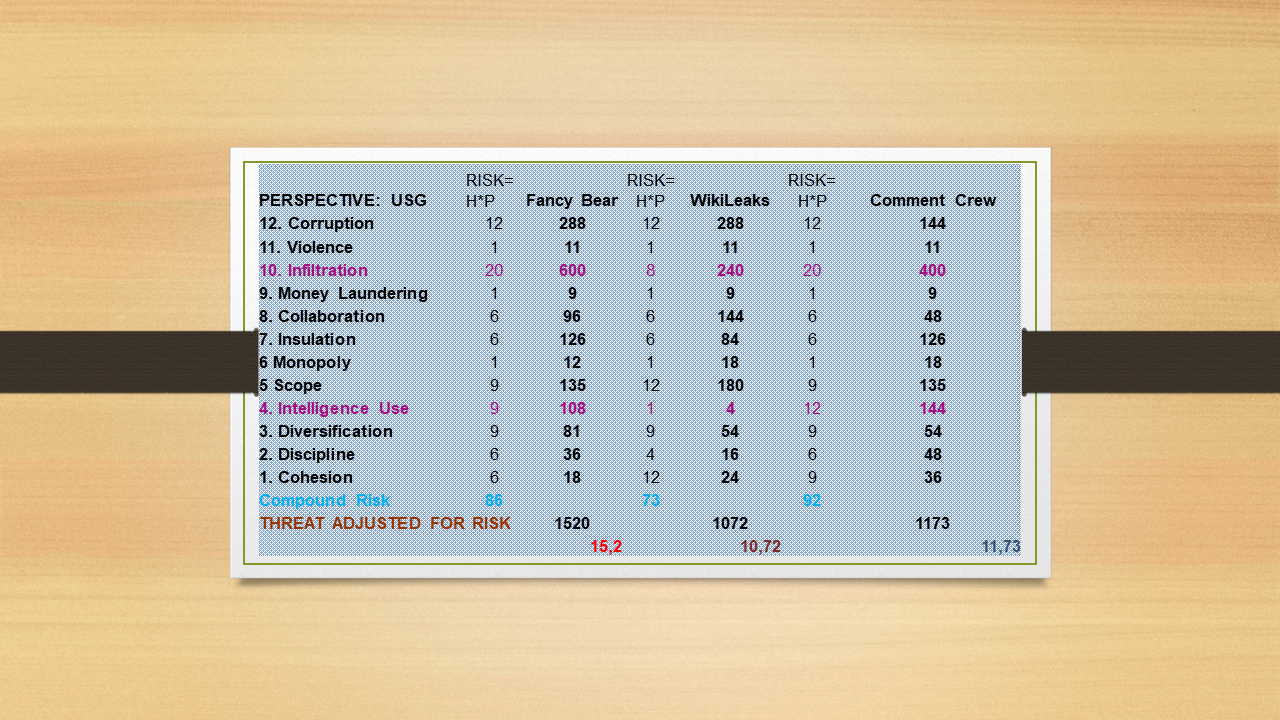
The way I see it, there is a big difference in the operational modalities used by our three contestants. At least, that’s what I gleaned from the open sources that I readily admit may have got it all wrong.
CC and FB appear to be essentially foreign agents that actively pursue collection of sensitive information from US sources or dissemination of distorted information to US audiences.
WL, on the other hand, assumed a fairly passive role. It receives information offers from a variety of sources and publishes it without targeting any specific audience in particular.
If that distinction is correct, both CC and FB would be actively pursuing infiltration of US sources and social media. That would generate increased risk to USG.
WL, on the other hand, would probably stay pretty passive in that respect.
GIVEN THE HIGH WEIGHT OF THE “INFILTRATION” ATTRIBUTE, THIS ASSUMPTION MAKES A DRAMATIC DIFFERENCE.
Scores for the attribute “Infiltration” were first set in the LM 1.0 matrix – FB 3, WL 3, CC 2.
These same values were successively transferred first to the LM12 matrix and then to the LM 2.0 matrix.
The total scenario index in LM 1.0 could not be swayed by any particular attribute value. There were too many of those – 19. And the weighting steps are pretty modest, 0,01-0,02.
The LM 2.0 matrix, being top-heavy, has a slightly different dynamics. It aims at finesse. It is particularly well suited for obtaining fine-tuned rankings of threat agents that appear to be mostly homogeneous.
For most attributes, there would be only minimal variance among actors. Both individual attribute and risk scores will be consistently low, high or in between.
But there is a good chance that diligent risk analysis will uncover one or two attributes that have very different risk profiles. If located sufficiently high up the weighting order, such subtle and initially concealed differences in our perception can lead to significant shifts in the threat ranking.
This treatment of risk also allows to introduce the concept of COMPOUND RISK. It just might merit a bit of further thinking.
Replacing scenario-level harm and risk indices with individual risk indices for actors at attribute level adds new utility to LM2.0.
It recalibrates the focus of our analysis. Here we can test if we are not being misled by our assumptions that may be affected by biases.
BY DECOMPOSING OR FRAGMENTIZING THE RISK INDEX WE CAN CHECK IF OUR PERCEPTIONS OF AGENT HOMOGENEITY ARE CORRECT.
Producing a threat ranking that uses fragmentized risk assessment may well be a highly desirable outcome.
In our specific case, using this technique permitted to identify a previously unobserved break in homogeneity at the level of Attributes 10 and 4. It reduces our overall assessment of the threat level posed by WL quite radically – by about a third.
In summary, the threat ranking conducted by my students (with a little helping hand from me) using the techniques of expanded T4 matrix in combination with the Long Matrix yielded the following results:
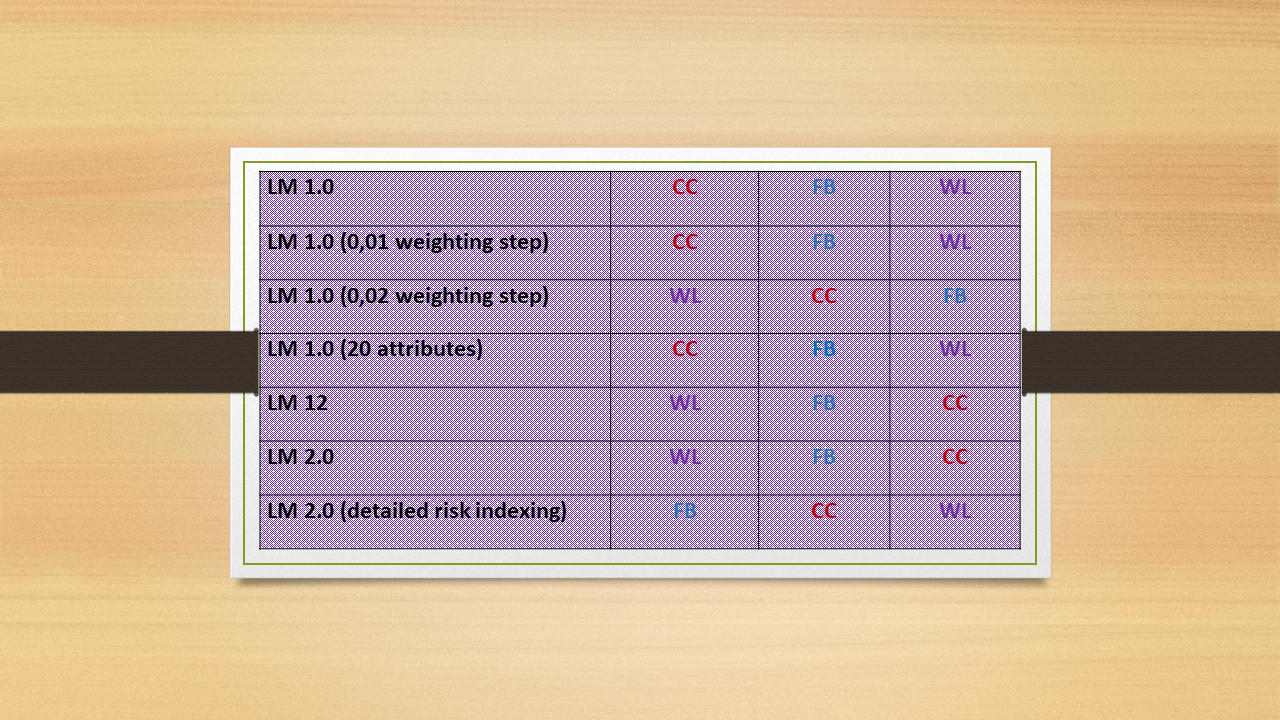
IF YOU ASKED ME WHAT TECHNIQUE/TOOL IN MY OPINION PRODUCED THE MOST ACCURATE RANKING, I’D JUST SHRUG MY SHOULDERS.
I am not sufficiently informed on the subject of cybersecurity threats to offer any judgments.
I am mostly familiar with the use of the Long Matrix for ranking threats generated by organized crime groups. That is also an area of application for which it has been originally intended.


